
Measuring river flow: simple methods
To measure river flow, we calculate Q = V × Sm: the mean current speed (m/s) multiplied by the wetted area of the cross-section (m²), which gives a flow rate in m³/s. Three means can provide it: the float, the sluice gate and the weir. We gather these methods here, collected from various websites (notably risques.meteo.edu and moulinafer.free.fr), because flow rate is the first quantity to know before assessing the power a watercourse can supply.
In this page:
- Measuring river flow with a float or a tracer
- Sluice gate flow: the orifice formula
- Thin-wall weir flow: the formula
1: Measuring river flow with a float or a tracer
Gauging the flow of a watercourse is a delicate operation that takes some practice to reach a reasonable accuracy. The float method is the simplest, and we describe it in three steps.
Equipment: a bottle or a piece of wood, a colored tracer, a graduated stick, water, a bucket, a stopwatch, a tape measure (depending on the section studied), a notepad and pencil, a calculator, graph paper and boots.
Step 1: measure the mean current speed
The speed is obtained from:
V = D / t
where V is the speed (m/s), D the distance between two points (m) and t the travel time (s).
First choose a gauging section where the streamlines are parallel to each other. To do so, remove the obstacles (stones, branches…) that locally disturb the flow in the study area.
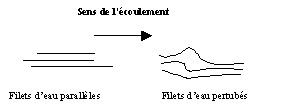
Only the zone with parallel streamlines is suitable for gauging; disturbed streamlines spoil the measurement.
Two techniques are possible.
- The weighted float. Take a bottle filled with water or a piece of wood. Define a starting point (1) and an end point (2), then measure the distance D between them. Put the float in the water, as close to the center as possible, and time how long it takes to reach point 2. Then calculate the speed V = D / t.
- The tracer. Prepare a colored solution in a bucket, non-polluting and preferably biodegradable. It must be colored enough to remain visible once diluted in the current. Define a starting point (1), where you pour the solution, and an end point (2), where you measure the time. Note the distance D. Pour the solution at point 1, in the center of the stream, then time the arrival of the colored front at point 2 (duration t in seconds). Calculate the speed with V = D / t.
A float or tracer placed in the center mostly measures the surface speed, which is higher than the mean speed of the section. Keep this bias in mind: the source gives no correction factor, and we do not invent one.
Step 2: measure the wetted area
To know the shape of the bed at the gauging section, you need to record the water depth at several points.
- Measure the distance between the banks (L, in meters).
- Record the water depth with a graduated stick placed on the bottom. Take several measurements across the width, at regular intervals, perpendicular to the banks (h, in centimeters).
- Plot the values of h on graph paper to draw the profile of the section.
- Calculate the wetted area Sm using the grid and convert it to m². Note Sm.
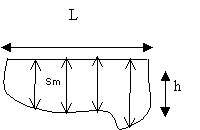
The width L, the depths h recorded at regular intervals and the wetted area Sm they delimit.
Step 3: calculate the mean flow rate
Q = V × Sm
where Q is the flow rate (m³/s), V the mean current speed (m/s) and Sm the wetted area of the study section (m²).
If you can, repeat the measurements of steps 1 and 2 at different times of the year (winter, spring…) and build a hydrograph, that is, flow rate against time. Then compare the records and put forward hypotheses on how the flow varies (rainfall…).
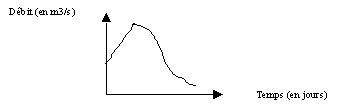
A hydrograph: the flow rises to the flood peak, then falls back gradually.
2: Sluice gate flow under pressure: the orifice formula
This means is convenient, because it is rare for a hydropower mill or plant not to have a gate on which to do the experiment. The gate is raised and set at the height needed for just the quantity of water to be measured to escape through the opening. The water is left to flow for a while to check that the upstream level neither falls nor rises. Otherwise, the flow through the opening does not match the normal flow of the river.
The flow through a thin-wall orifice under pressure is calculated by:
D = m × L × E × √(2 g H)
where D is the flow rate, L the length of the discharge opening (m), E its height (m), H the water head above the center of the opening (m), g the acceleration of gravity (m/s²) and m the discharge coefficient, which varies from 0.60 to 0.65 depending on the head and on the shape and position of the opening. With these SI units, D comes out in m³/s; the source expresses it in liters per second, that is D × 1,000.
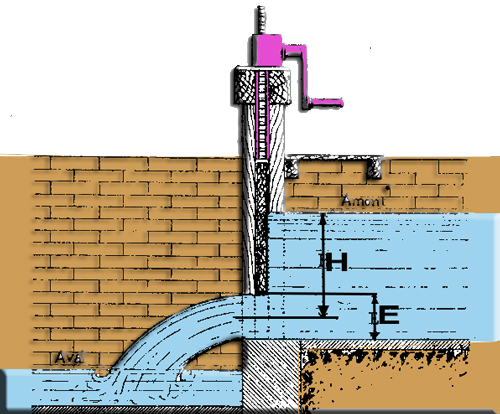
A raised gate: H is the upstream water head, E the opening height.
3: Thin-wall weir flow: the formula
The weir is above all a practical means of assessing the flow of a watercourse. The source considers it more accurate than the gate, and more widely used. It consists of a thin vertical wall built across the current, with its upper edge bevelled or fitted with sheet metal.
The flow rate is given by:
D = m × L × H × √(2 g H)
where D is the flow rate, L the width of the weir (m) and H the head over the crest (m), measured 1.50 m upstream according to the source. √(2 g H) is the theoretical flow speed (Torricelli), and m the discharge coefficient, due to the contraction of the water sheet, which varies from 0.38 to 0.42 depending on the case. As for the gate, D comes out in m³/s with these SI units.
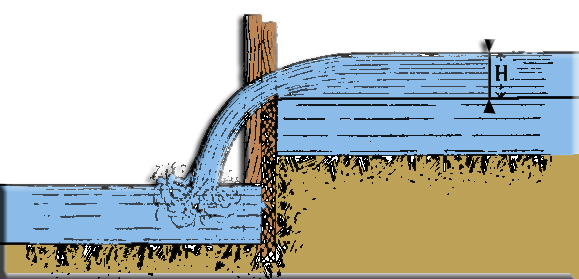
The water sheet spills over the wall: H is the water height above the crest.
To go further, we can link this flow rate to the available power with the page on the relation between power, energy, work and flow rate, or see how a power-extracting propeller captures energy from a current.
 Global site map
 Mecaflux
 Tutorials Mecaflux Pro3D
 Tutorials Heliciel
 Tutorials Heliciel PRO CFD
 Mecaflux Store
 Compare software functions
 Quotes, Orders, Payment Methods
 project technical studies